Stock Ticker Viewer & Analyzer using Python's Streamlit package
Starting on my co-op as a Liquidity Management & Parameters at RBC, I was able to discover a python package library during my research that enables the visualization of data into a streamlined modular process.
This got me to think back on my previous projects and some of the limitations they had in terms of displaying data. As such, I am revisiting one of my stock data extractors, and adding in a modular web based coat of paint to it.
Streamlit is an open source app framework that allows you to connect your back end to a front end that is built entirely by python code. That means, that a lot of tasks (like say creating a chart, or creating a button) are modular; invoke the class and place your arguments, and streamlit automatically compiles it to your localhost browser.
Due to the time constraints I am on, I won't show any code or pseudo-code in this post. Feel free to check out my code over at my GitHub here: https://github.com/MyQuantJourney/MyQuantJourney/tree/dbf77854f3959471921abc79345525eb1111909f/Python%20Projects/Streamlit%20Stock%20Visualizer
Instead, I will be showing screenshots of the web app and what they do:
- Dashboard Sidebar
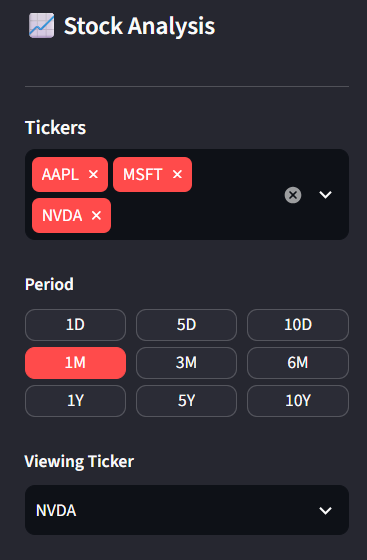
In here, you can access the 'Tickers' drop-box. You can add in any ticker, and it will automatically connect and load from yfinance.
You can choose the time period, because of caching, if you load the 1 month data, then go to the 3 month data, it will only need to extract month 2 and 3, since month 1 already exists. This ensures that the app is quick and responsive.
There is a 'Viewing Ticker', where you choose one of the tickers on your list, and be able to view more information about it. Will see the details about it below.
- Main ticker viewer
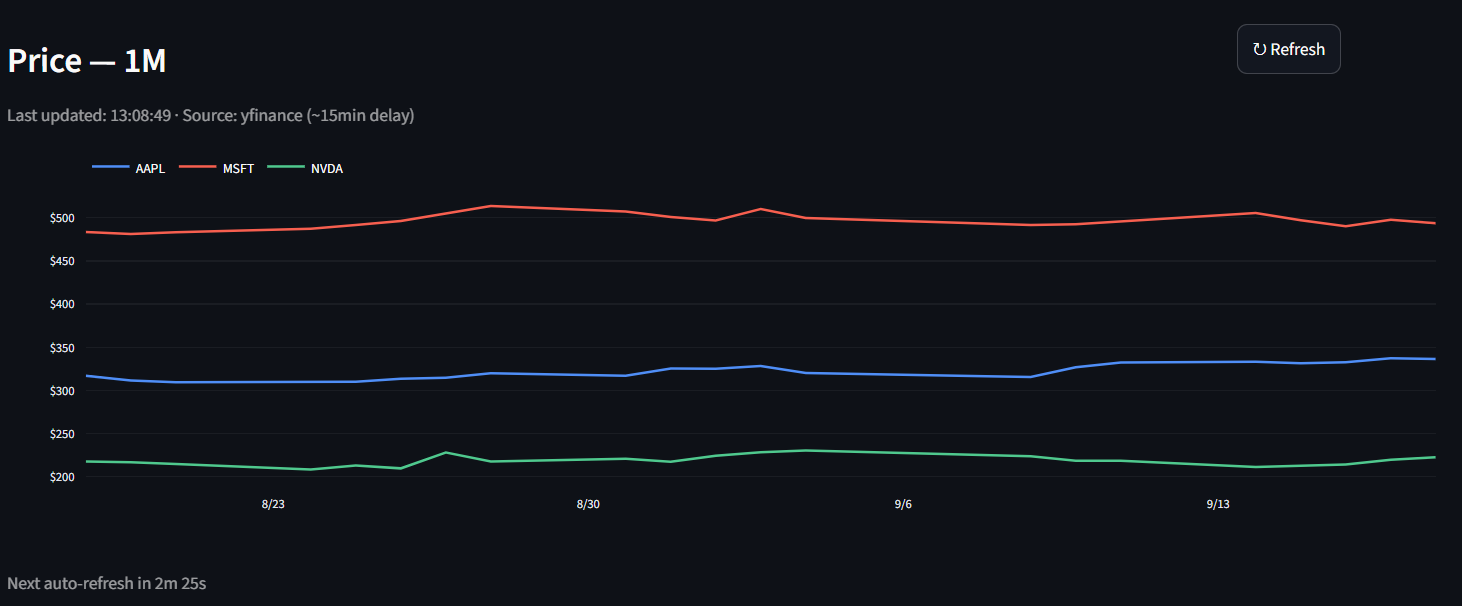
Here, you can view the tickers you have selected and see their prices over the time period chosen.
- Key Indicators
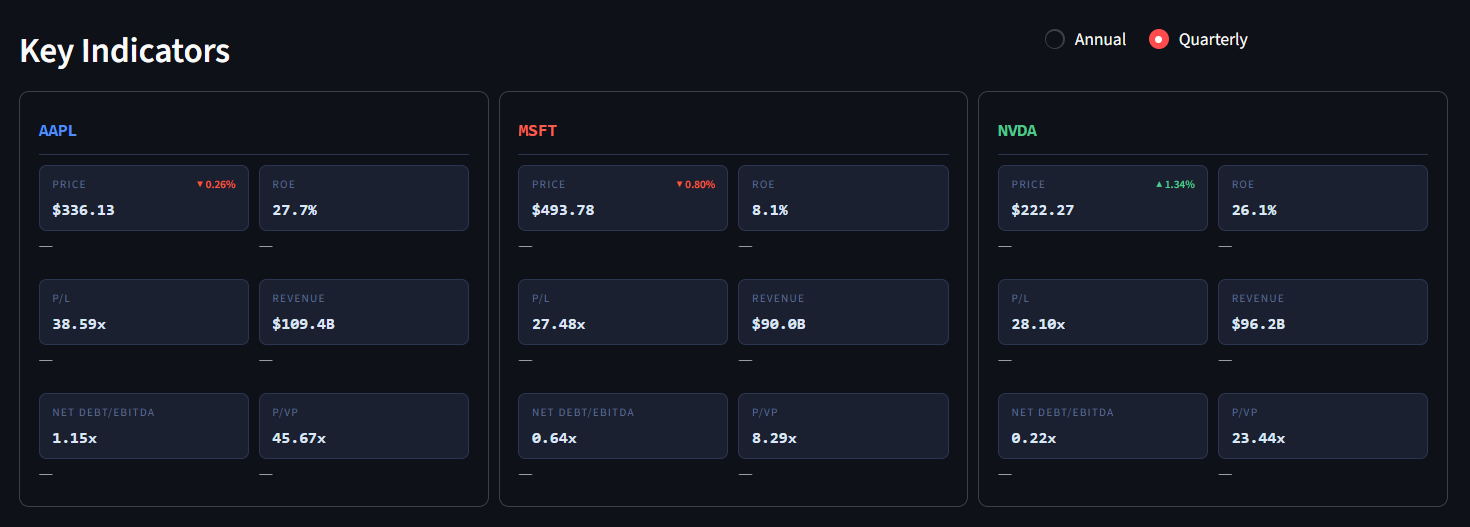
The key indicators are:
- Price
- P/L
- Net Debt/EBITDA
- ROE
- Revenue
- P/PV (Price to Present Value)
You can choose between viewing this data as 'Annual' or 'Quarterly'
- Historical Charts
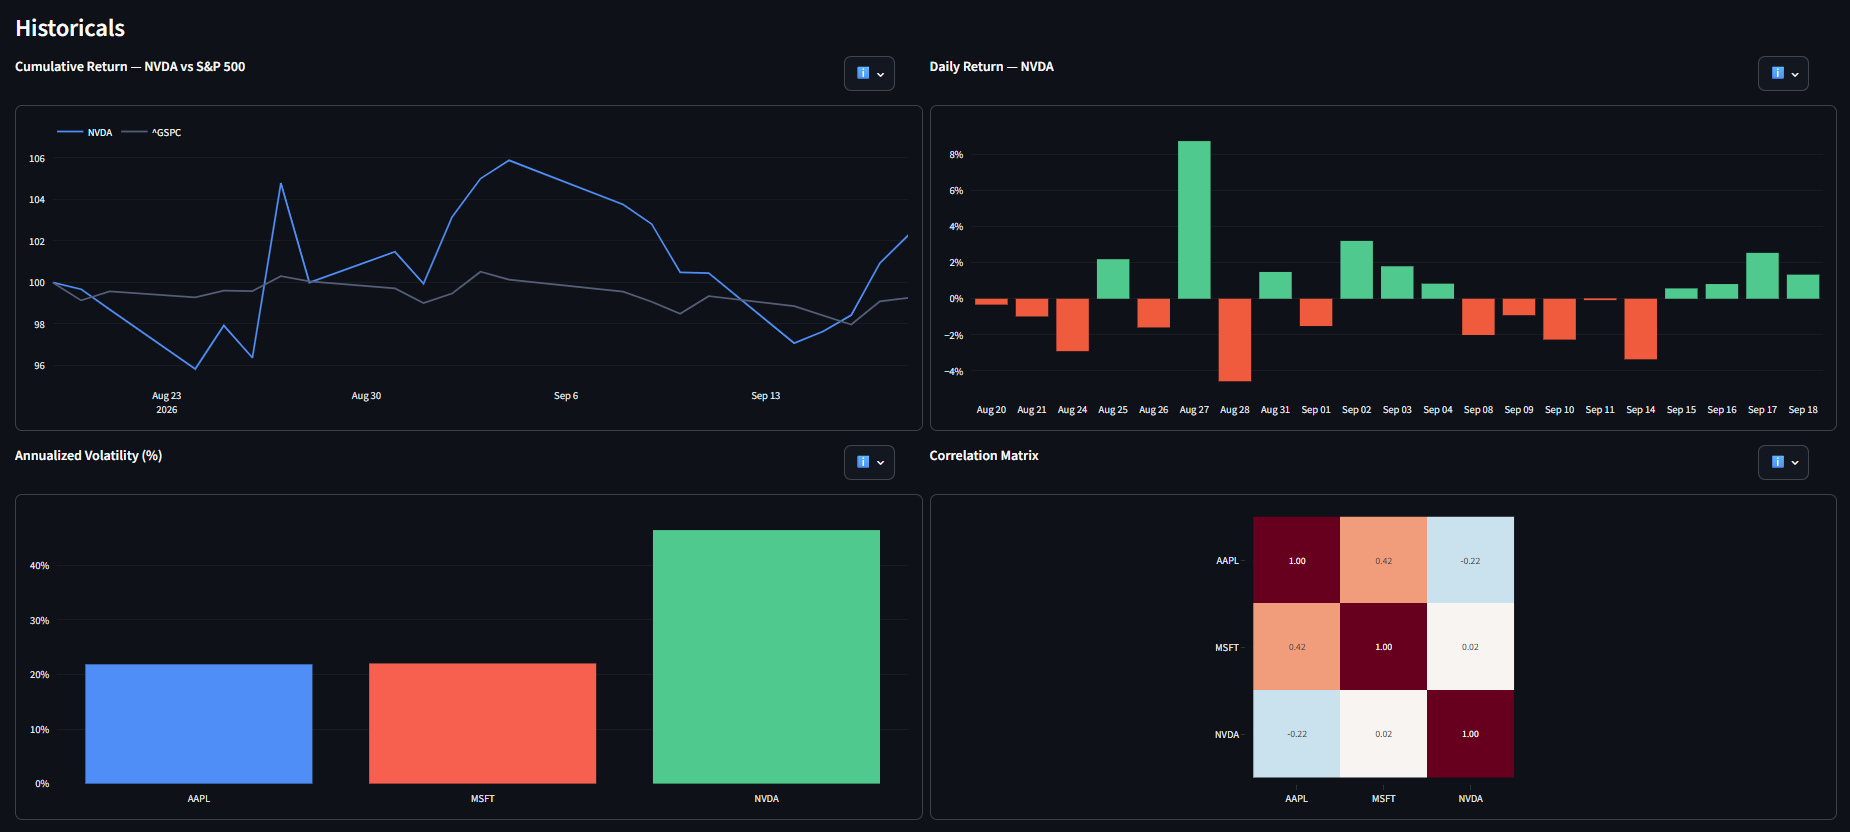
There are 4 charts that showcase the 'Viewing Ticker' stock from point 1.
- Cumulative Return comparing the stock to the S&P 500
- Daily Return
- Annualized Volatility
- Correlation Matrix between the stocks you listed
- Moving Averages
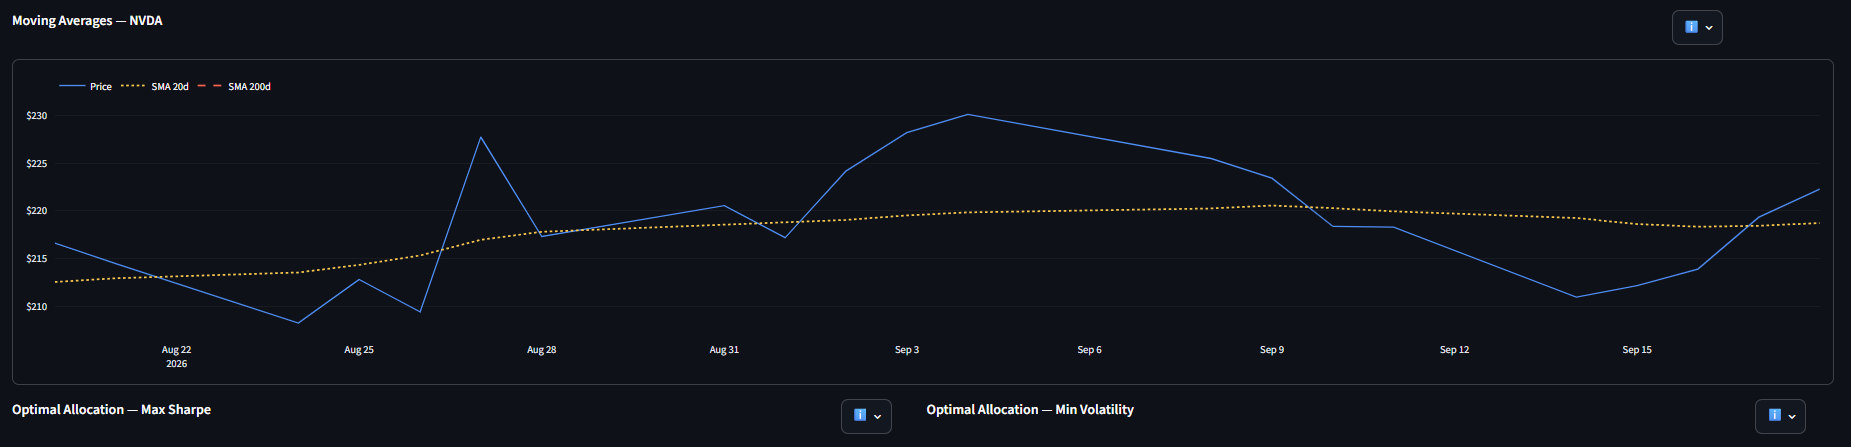
Due to simplicity, the moving averages are always 30-day.
Conclusions
Being able to utilize streamlit to not have to use any other programming language to display information is a game changer for me. I like using python because of its rapid ability to create scripts, and having the UI element be modular plug and play makes this all the more easier.
As always, the code can be found here: https://github.com/MyQuantJourney/MyQuantJourney/tree/dbf77854f3959471921abc79345525eb1111909f/Python%20Projects/Streamlit%20Stock%20Visualizer