Building a Live Regime Detector Dashboard using Hidden Markov Chains

Being able to handle large streams of live data is very important when considering inserting them into financial models.
As I am going through my list of tasks for a general Interactive Brokers (IBKR) automated app, one of them is to build a system that can detect regime changes in real time. Markets do not behave the same way all the time, they shift between periods of calm, normal activity, and turbulence.
A Hidden Markov Model (HMM) is well-suited for this because it treats the true market regime as a hidden state that we cannot observe directly. Instead, we observe volatility, and the model infers which regime we are in by combining two pieces of information: how likely each regime is to persist or switch (the transition matrix), and how likely the observed volatility is under each regime (the emission model). Each new bar updates our belief using Bayes' rule, giving us a probability-weighted classification rather than a naive threshold.
This project wraps that inference engine into a live dashboard. The goal is not just to display prices, but to surface the underlying regime in real time as ticks arrive.
Building the GUI application using tkinter + matplotlib
tkinter is Python's standard GUI toolkit, and matplotlib provides the plotting backbone. Together they allow for a lightweight, single-file desktop application that embeds live candlestick charts directly inside the window.
1-Setup & Imports
Import GUI widgets, threading, numerical tools, plotting, and the IB API. Ensure that you have an instance of TWS/IB Gateway up and set to the paper trading port (default value of 7497).
2-Broker Gateway
Talks to TWS in a background thread. Sends requests, receives ticks and historical bars, forwards price updates to the dashboard.
Gateway:
    connect(host, port) → open socket, listen for messages
    request_history(contract, duration) → fetch past bars
    subscribe(contract) → start live tick stream
    on_tick(price) → notify dashboard
3-Price Bar
A 5-second bucket that accumulates ticks.
Bar(start_price):
    track open, high, low, close, tick count
    add_tick(price) → update high/low/close
    volatility → (high - low) / close
4-Regime Classifier
A 3-state Hidden Markov Model. Uses Bayes' rule to guess whether the market is calm, normal, or turbulent based on each bar's volatility.
Classifier:
    calibrate(historical_bars) → learn symbol-specific volatility ranges
    classify(latest_bar) → predict → observe → update belief → pick most likely regime
Sticky transitions (90% chance to stay in the same regime) prevent erratic flipping.
5-Dashboard
Setup the UI that ties it all together.
Dashboard:
    connect → start Gateway thread, wait for confirmation
    start_stream(symbol) → calibrate classifier on history, subscribe to live ticks
    on_tick(price) → build current bar
    bar_manager → every 5s: finalize bar, classify it, start new bar
    draw_chart → candlesticks with regime-colored backgrounds
Three threads run in parallel: GUI, Gateway listener, and bar manager. A single lock protects shared bar data.
6-Entry Point
Create window → instantiate Dashboard → run event loop until closed.
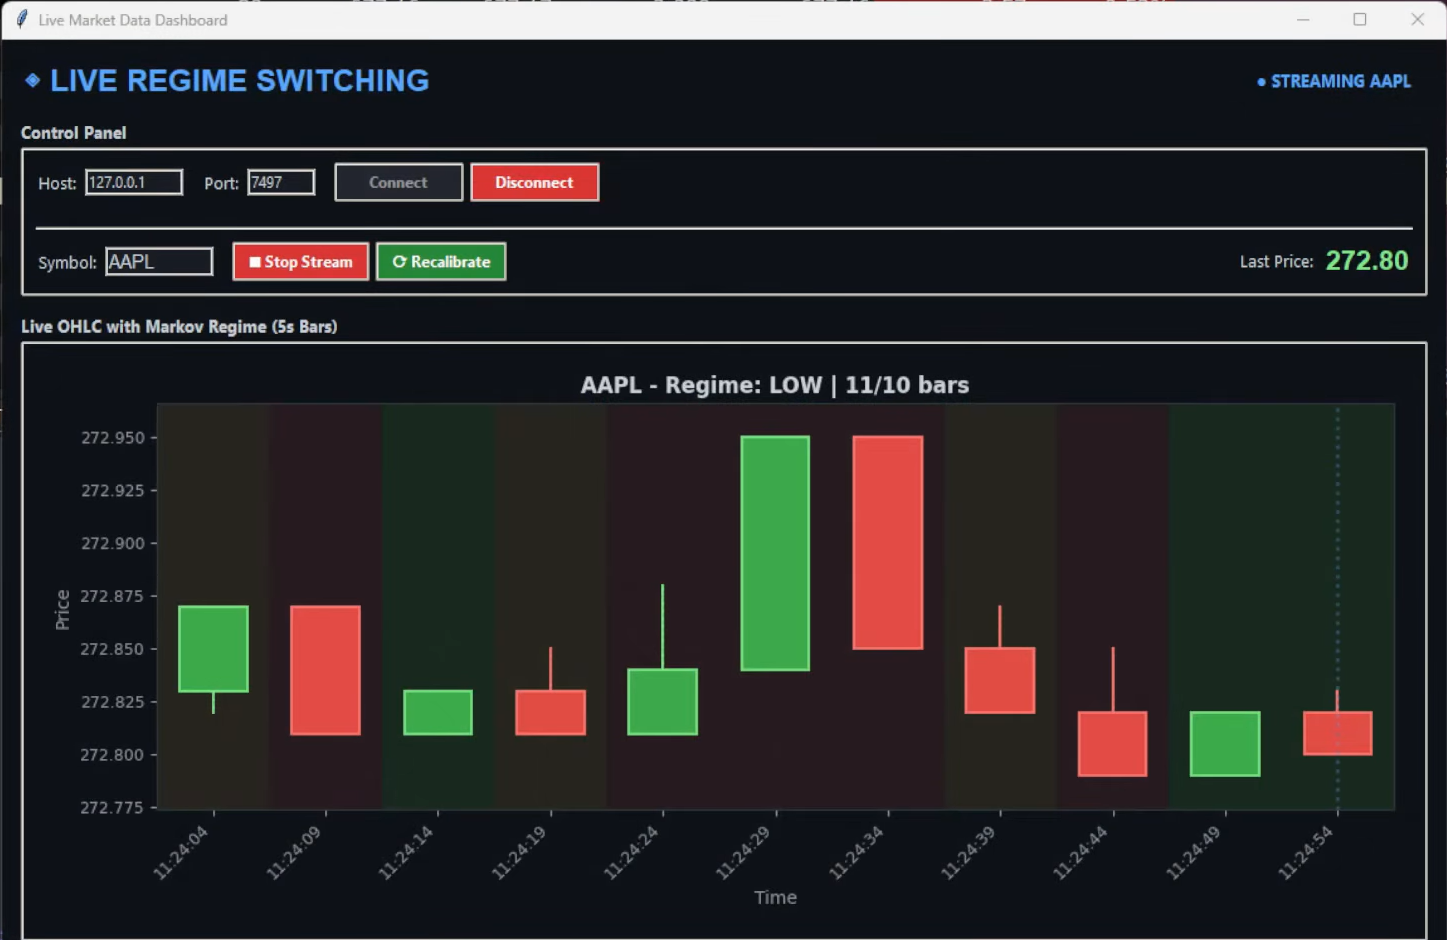
Live OHLC Chart with Markov Regime Switching (5s Bars)
Conclusion
IBKR has a multitude of ways of getting a live data feed for analysis. Once the API connection is working, data collection becomes routine. The real work is building a regime detector that adapts to each symbol's unique volatility fingerprint and updates its beliefs in real time as new information arrives.
The Hidden Markov Model approach is useful because it avoids hard thresholds. Instead of declaring a regime based on a single volatility spike, it maintains a probability distribution over regimes and refines it bar by bar. The transition matrix encodes the idea that regimes cluster: calm periods tend to stay calm, turbulent periods tend to stay turbulent, and sharp jumps between extremes are rare. This prevents the whipsawing that a simple "if volatility > X then HIGH" rule would produce on outlier ticks.
As always, my Python code is available in my GitHub repo: https://github.com/MyQuantJourney/MyQuantJourney.git